Growth Balance Analysis

GBApp

GBApp: Upload Model

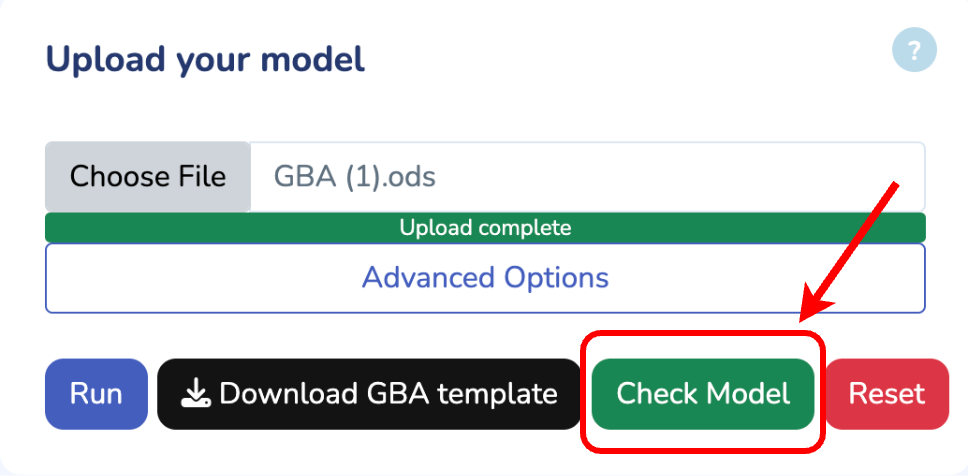
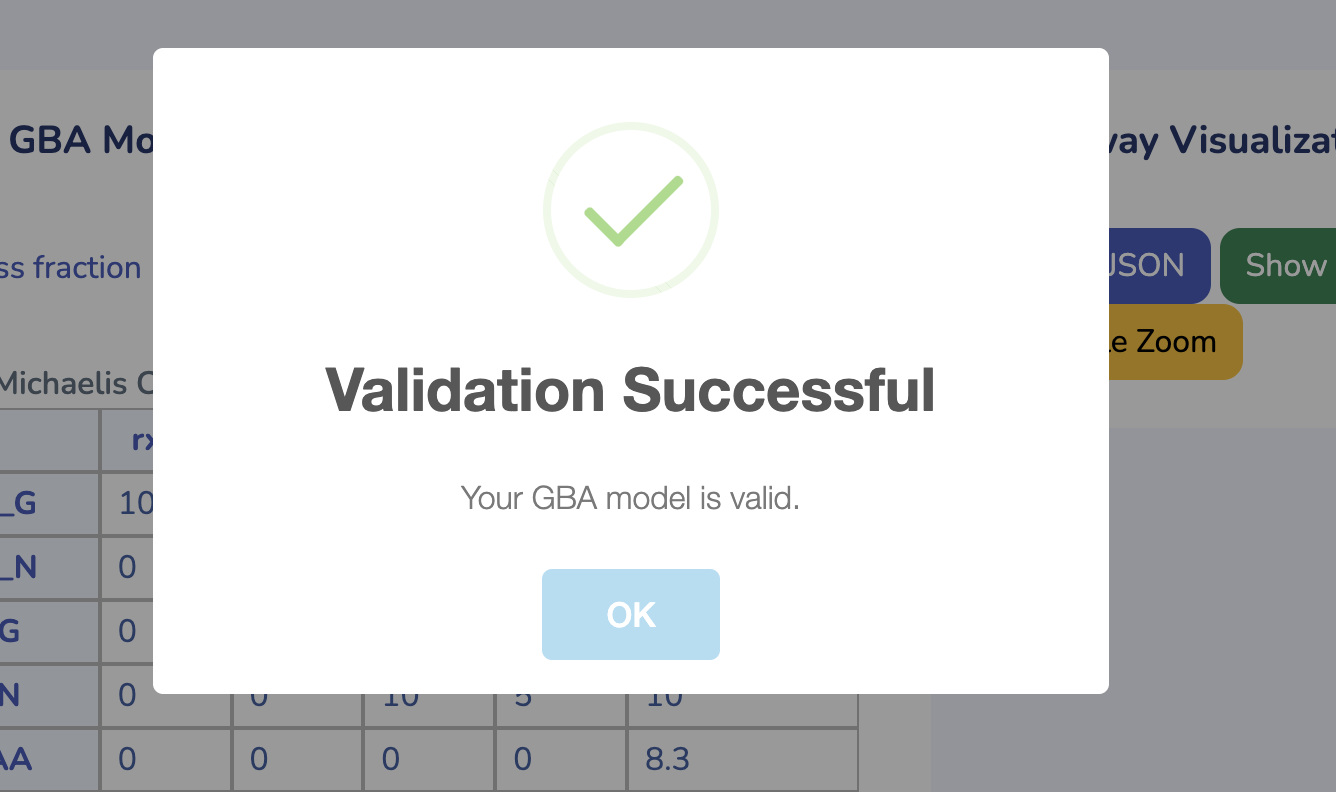
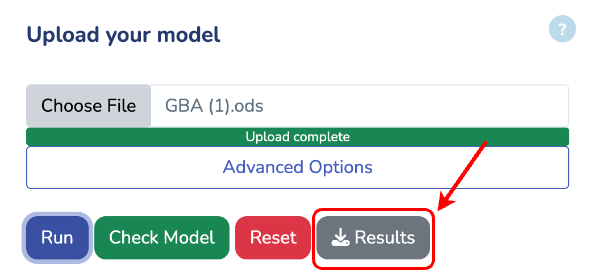
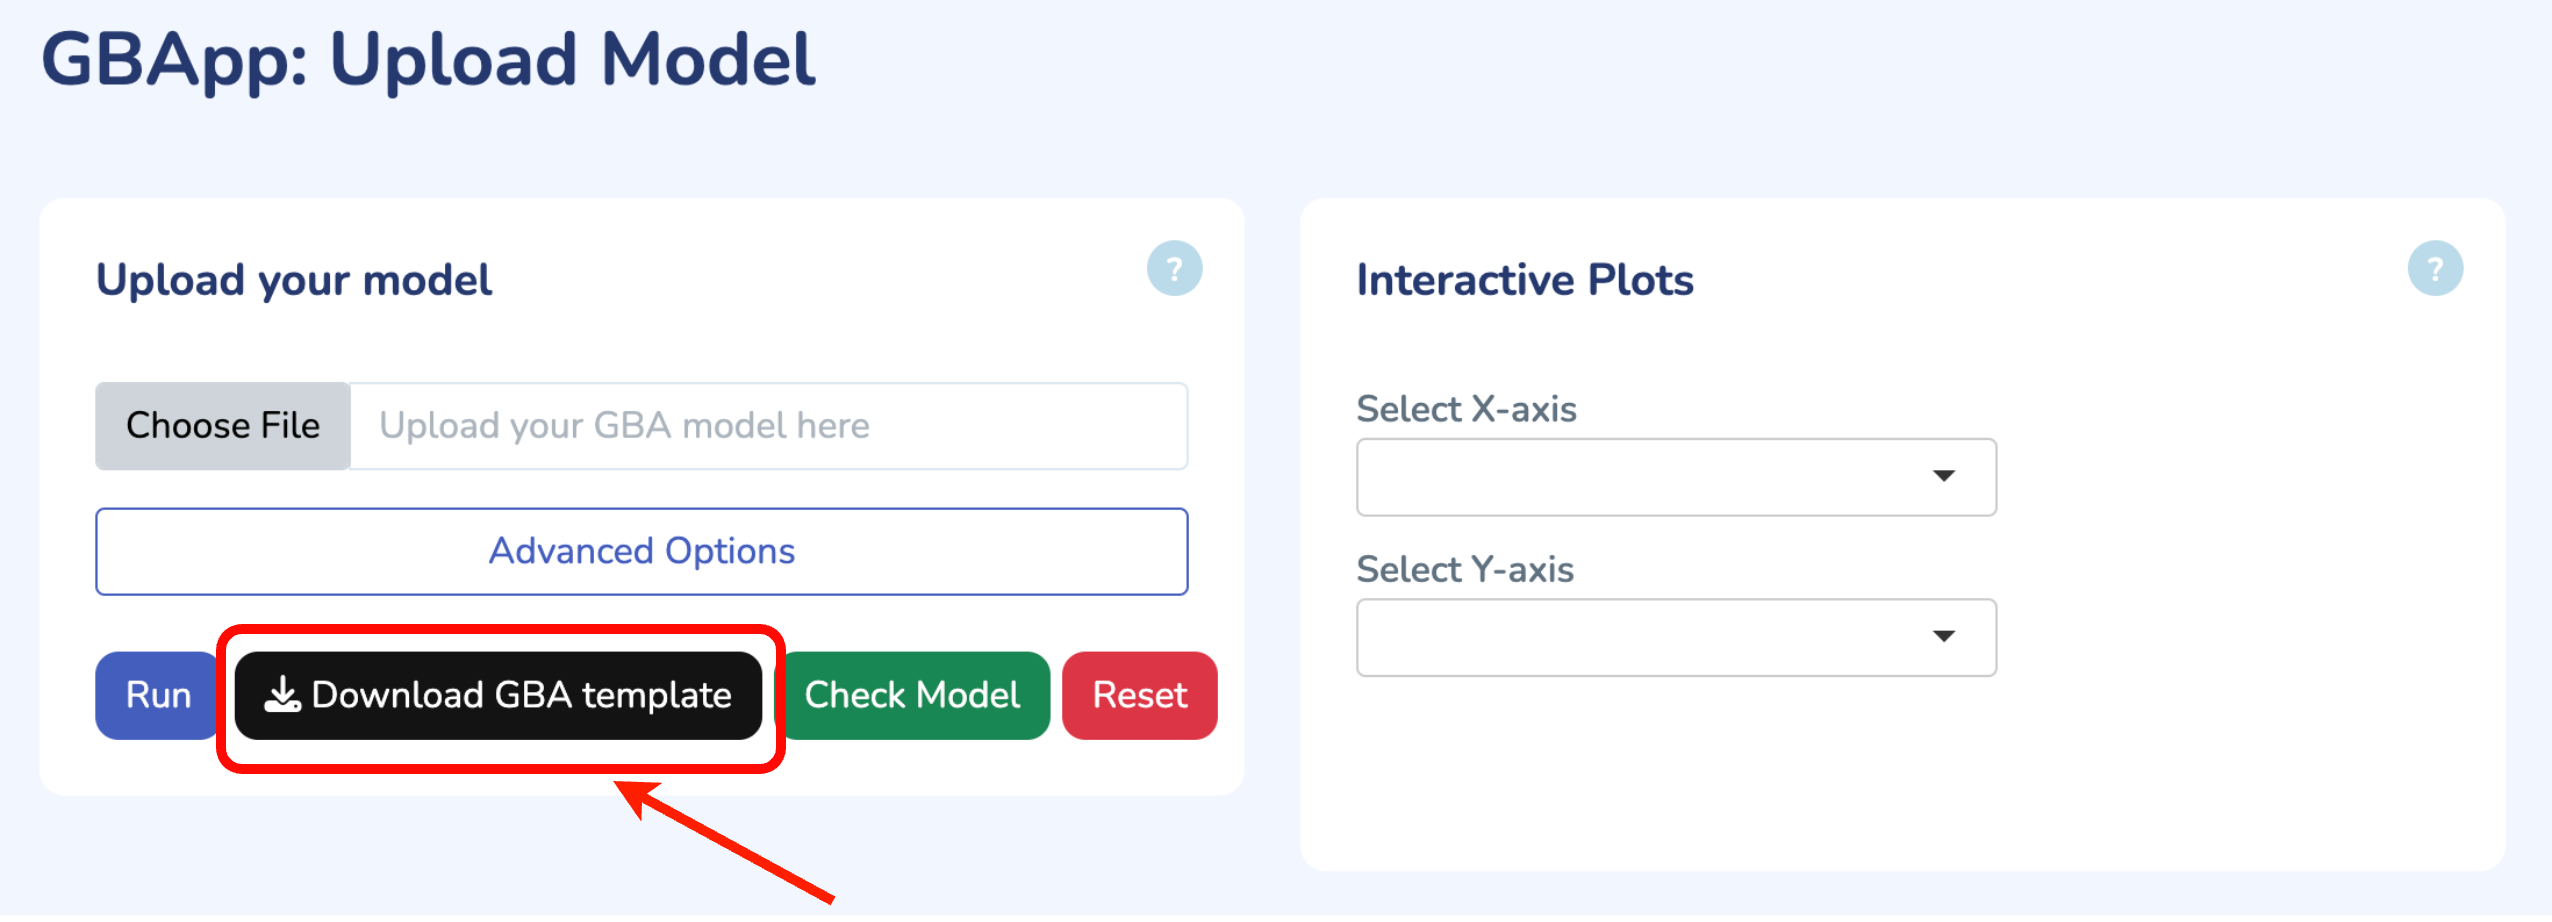
To get started, upload your GBA model by clicking "Choose File" and selecting your .ods file. If you don't have the GBA template yet, you can download it by clicking "Download GBA Template." After uploading your model, ensure its validity by clicking "Check Model." You'll be notified immediately if any issues are detected. For more control, you can use the advanced options to change the solver type for Non-linear Optimization (default is L-BFGS). Once you're ready, click "Run" to begin the optimization process for your uploaded model.

Upload your model

audio


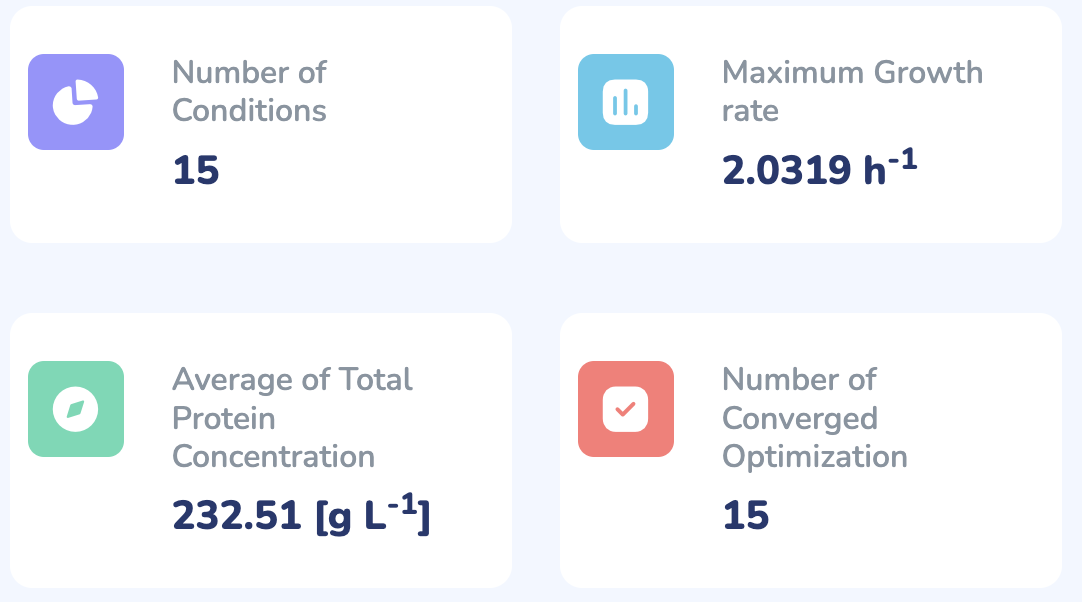
Number of Conditions
Maximum Growth rate
 h-1
Average of Total Protein Concentration
 [g L-1]
Number of Converged Optimization

Interactive Plots

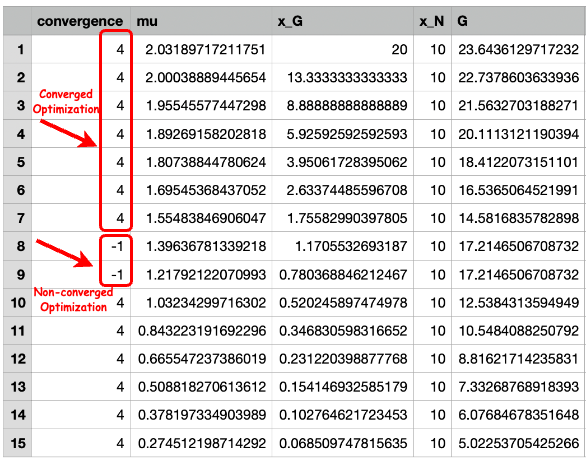
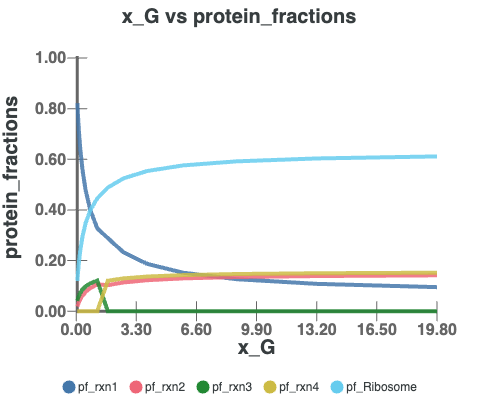
In this section, you can visualize the results by selecting different axes, such as Growth Rate, Protein Fractions/Concentrations, Fluxes, and more.


Your GBA Model

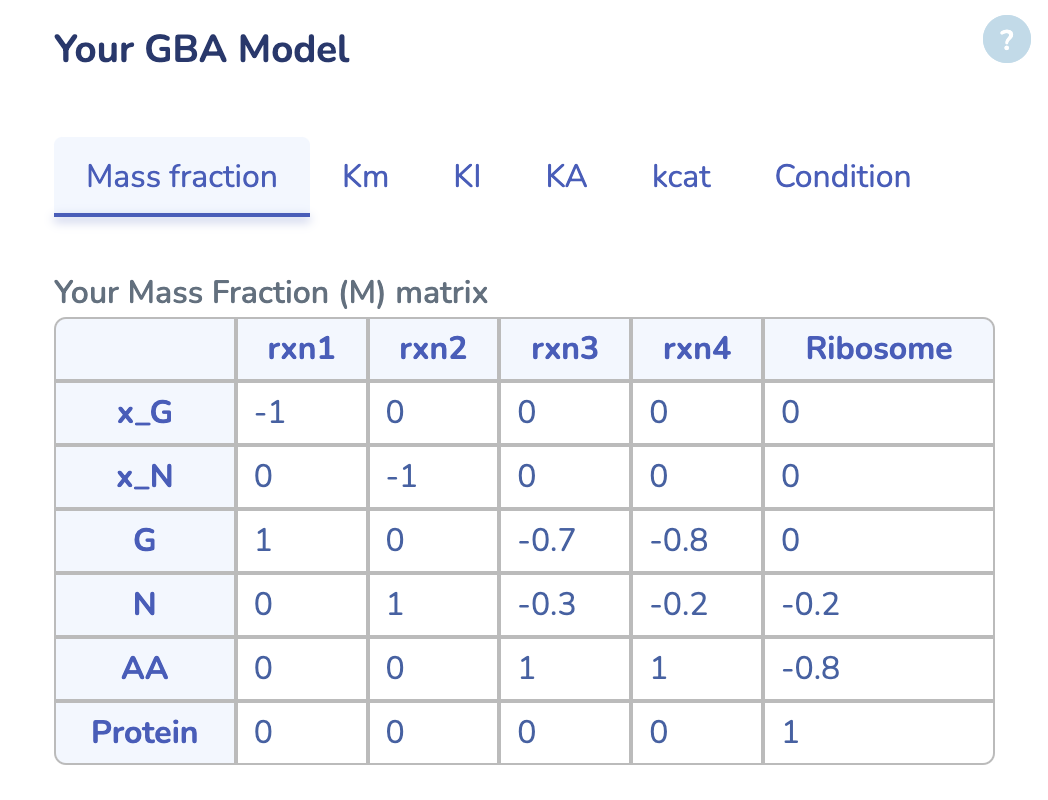
Here, you can view your uploaded GBA model. The first tab displays the Mass Fraction matrix (M) of your model. Even after optimization, you can modify any parameters and rerun the optimization by clicking "Run" in the last tab to see the changes. Additionally, you can download the updated model by clicking "Download" in the same tab.


Here, you can view your uploaded GBA model. The first tab displays the Mass Fraction matrix (M) of your model. Even after optimization, you can modify any parameters and rerun the optimization by clicking "Run" in the "Condition" tab to see the changes. Additionally, you can download the updated model by clicking "Download" in the same tab.


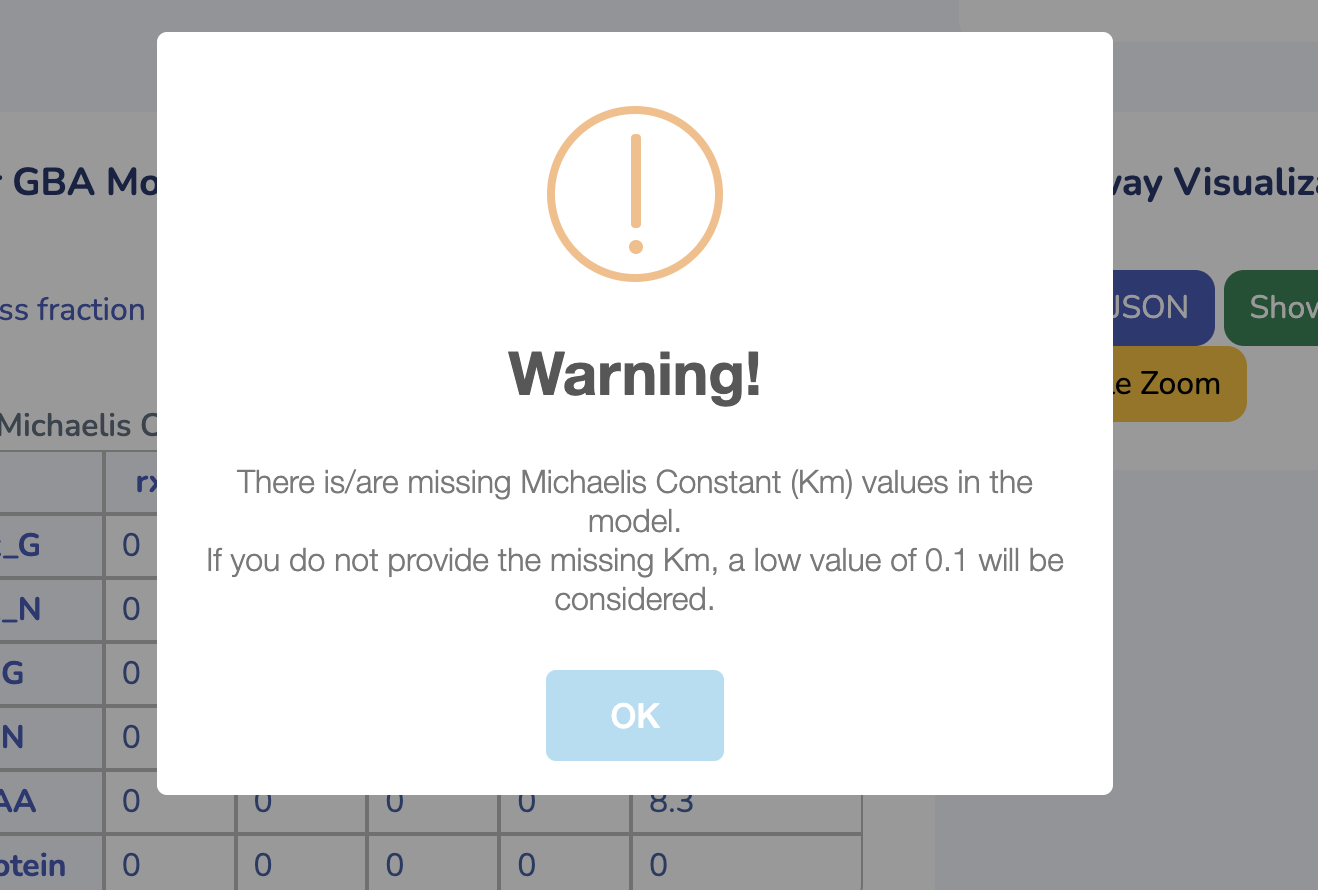
This section displays the Michaelis Constant (Km) matrix of your uploaded GBA model. Make sure each substrate in your reactions has a valid Km value; otherwise, a default value of 0.1 g/L will be used. You can also search for Km values in the table below, sourced from the BRENDA database. Please ensure Km values are mass balanced and converted to g/L by multiplying the Km values in molar units by the molecular weights of the respective substrates.


This section displays the Inhibition Constant (KI) matrix of your uploaded GBA model. You can modify the values directly here.


This section displays the Activation constant (KA) matrix of your uploaded GBA model. You can modify the values directly here.


This section displays the Turnover Number (kcat) matrix of your uploaded GBA model. You can search for kcat values in the table below, sourced from the BRENDA database. Ensure that kcat values are mass balanced and converted to 1/h (mass of product/mass of enzyme/hour) by multiplying the kcat values in 1/h units by the molecular weight of the respective product and dividing by the mass of its enzyme. "kcatf" and "kcatb" indicates the kcat for forward and backward reactions, respectively.


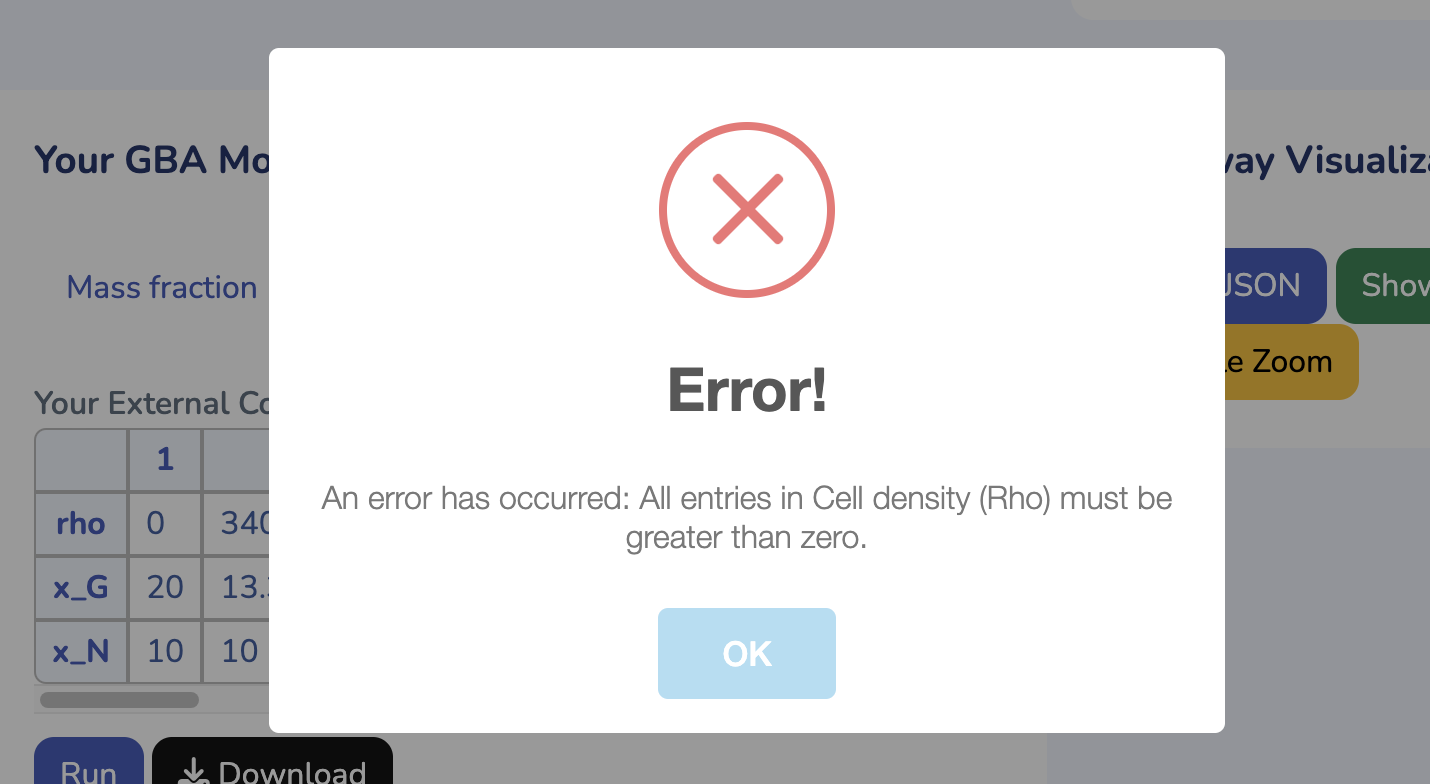
This section displays the External Concentration and Cell Density matrix. The parameter "Rho" represents the cell density in your model, while the other rows show the external concentrations. Ensure that all external concentrations are labeled with "x_". You can modify these values and rerun the optimization by clicking "Run" to see the changes. To download the latest version of your edited GBA model, click "Download."

Download

Pathway Visualization

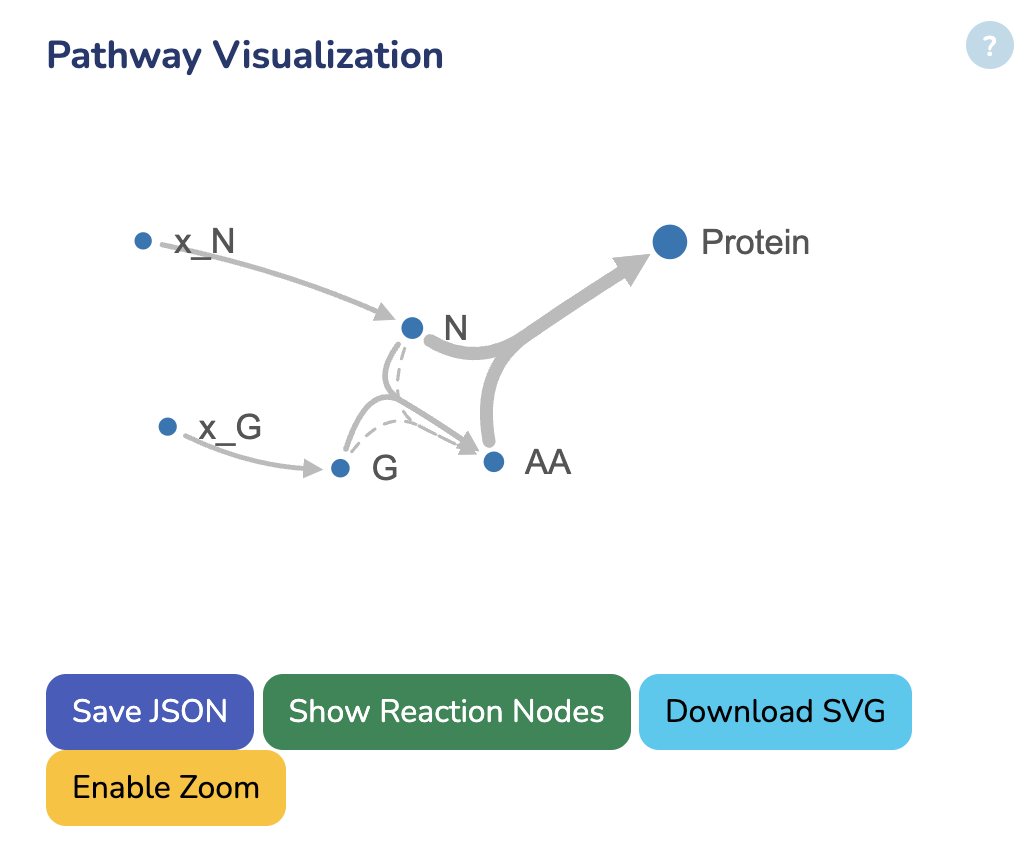
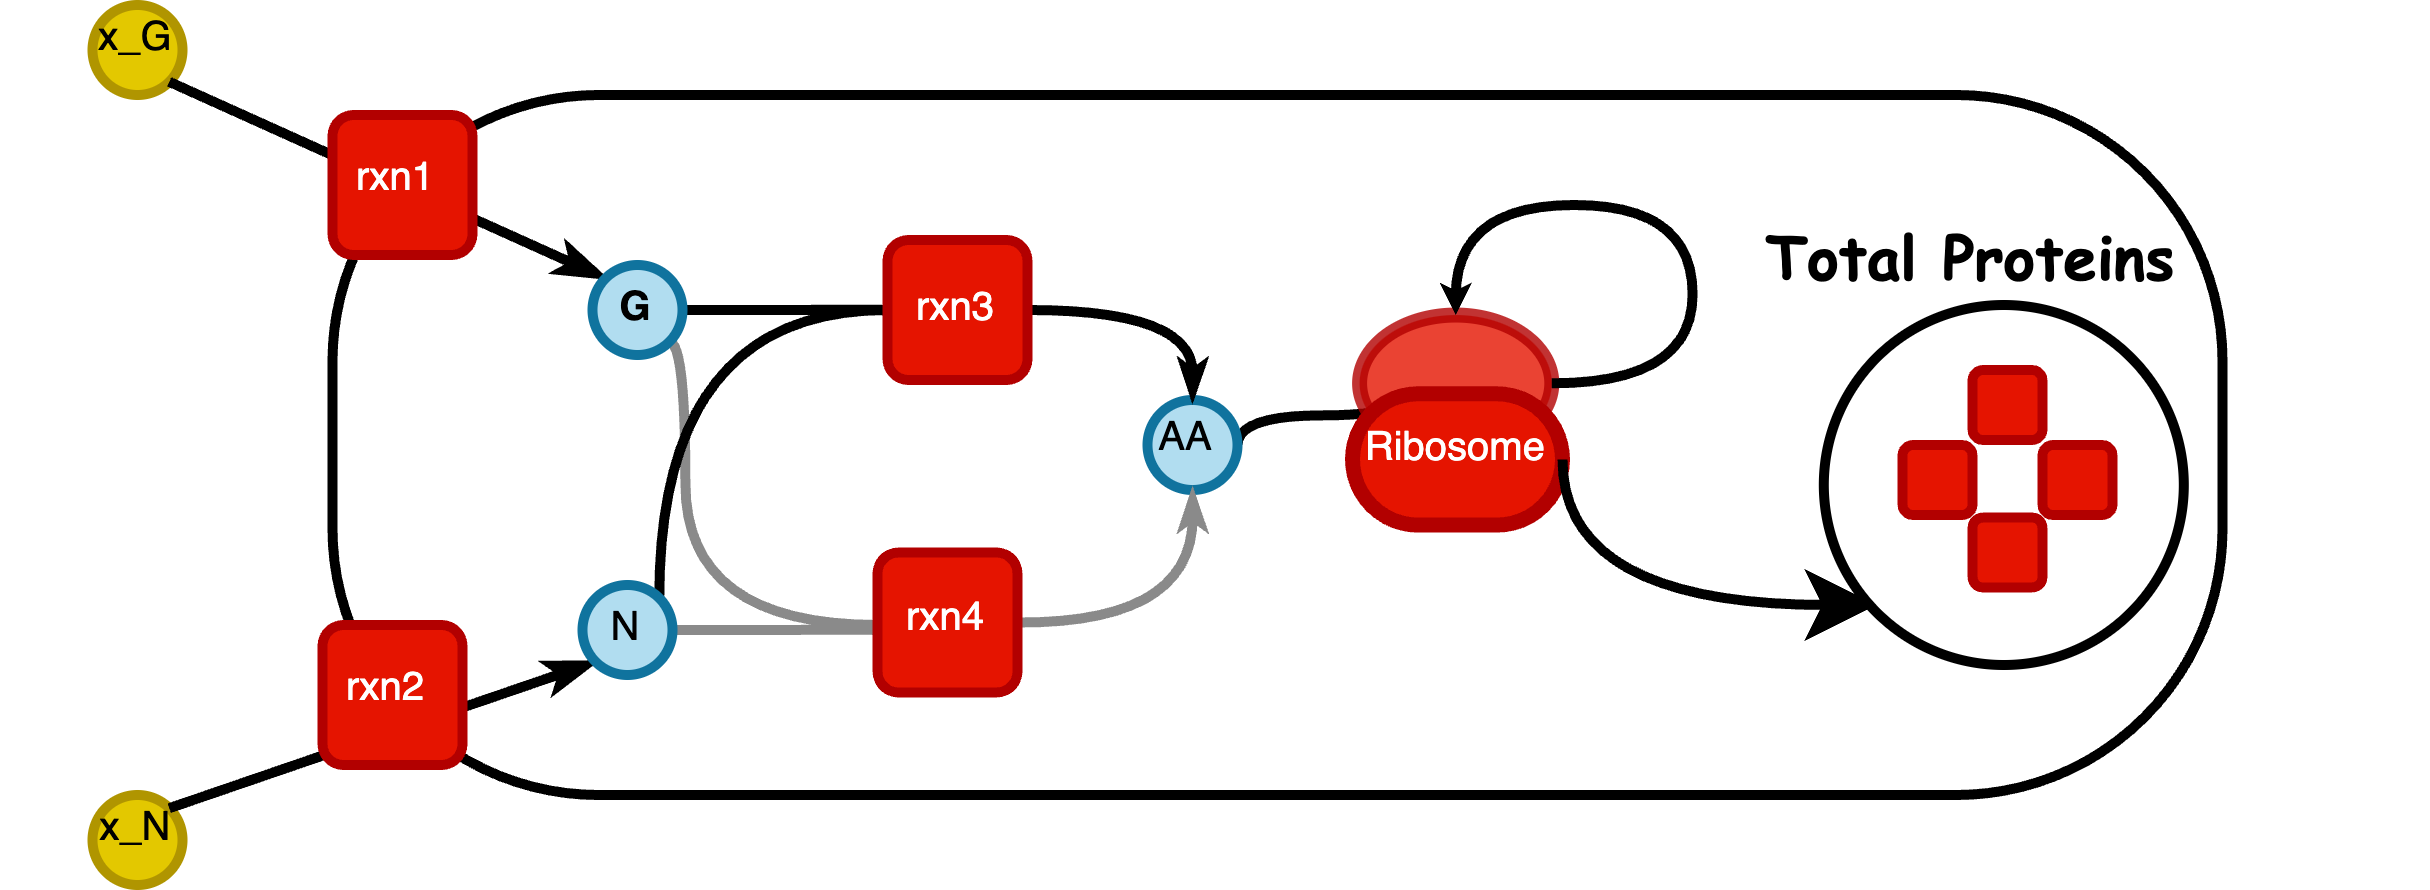
In this section, you can view the network visualization of your GBA model. The dot size represents metabolite concentrations, while the line thickness indicates protein concentrations, both as results from the optimization. You can download the visualization results below.
GBApp: Create Model

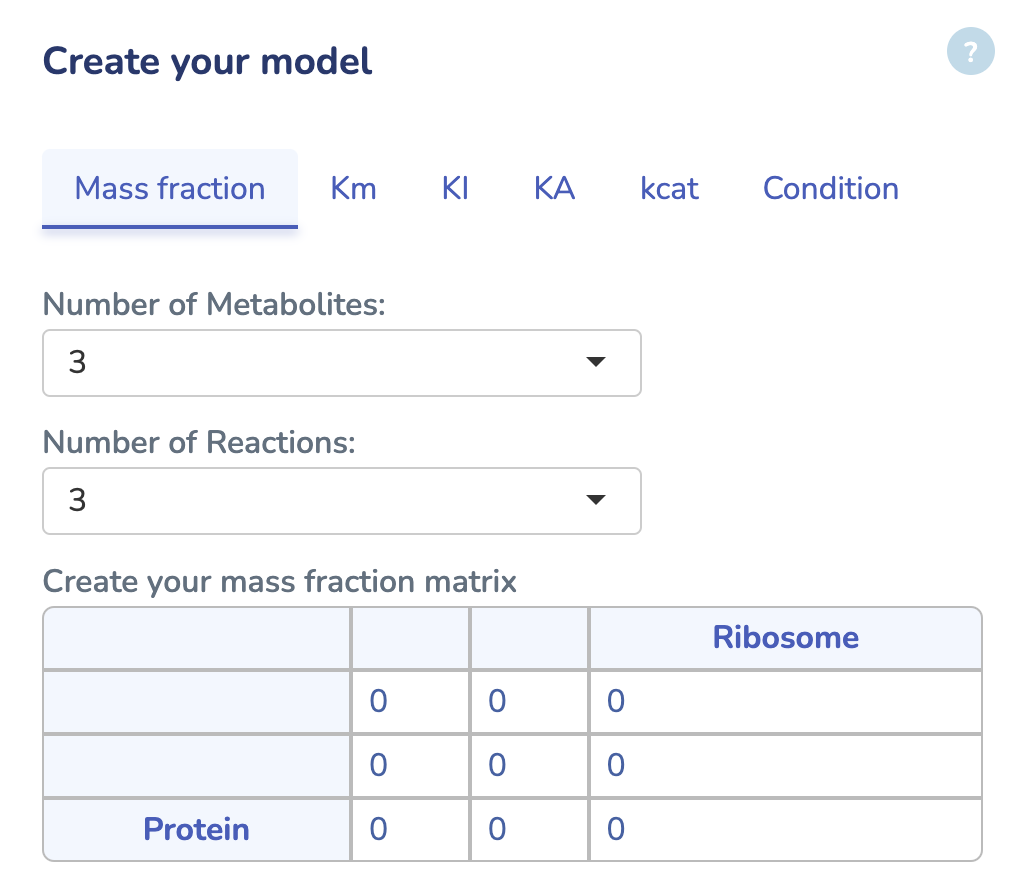
Create your model

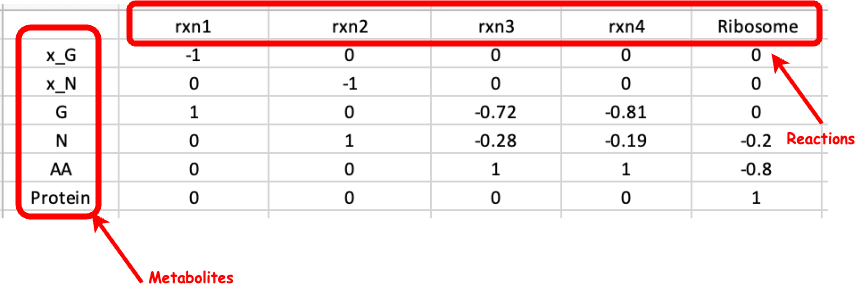
Here, you can create your GBA model by selecting the number of metabolites and reactions. The first tab displays the Mass Fraction matrix (M) of your model. Ensure that the M matrix is mass normalized: the sum of metabolite fractions should equal -1, and the sum of product fractions should equal +1 for each reaction.

audio

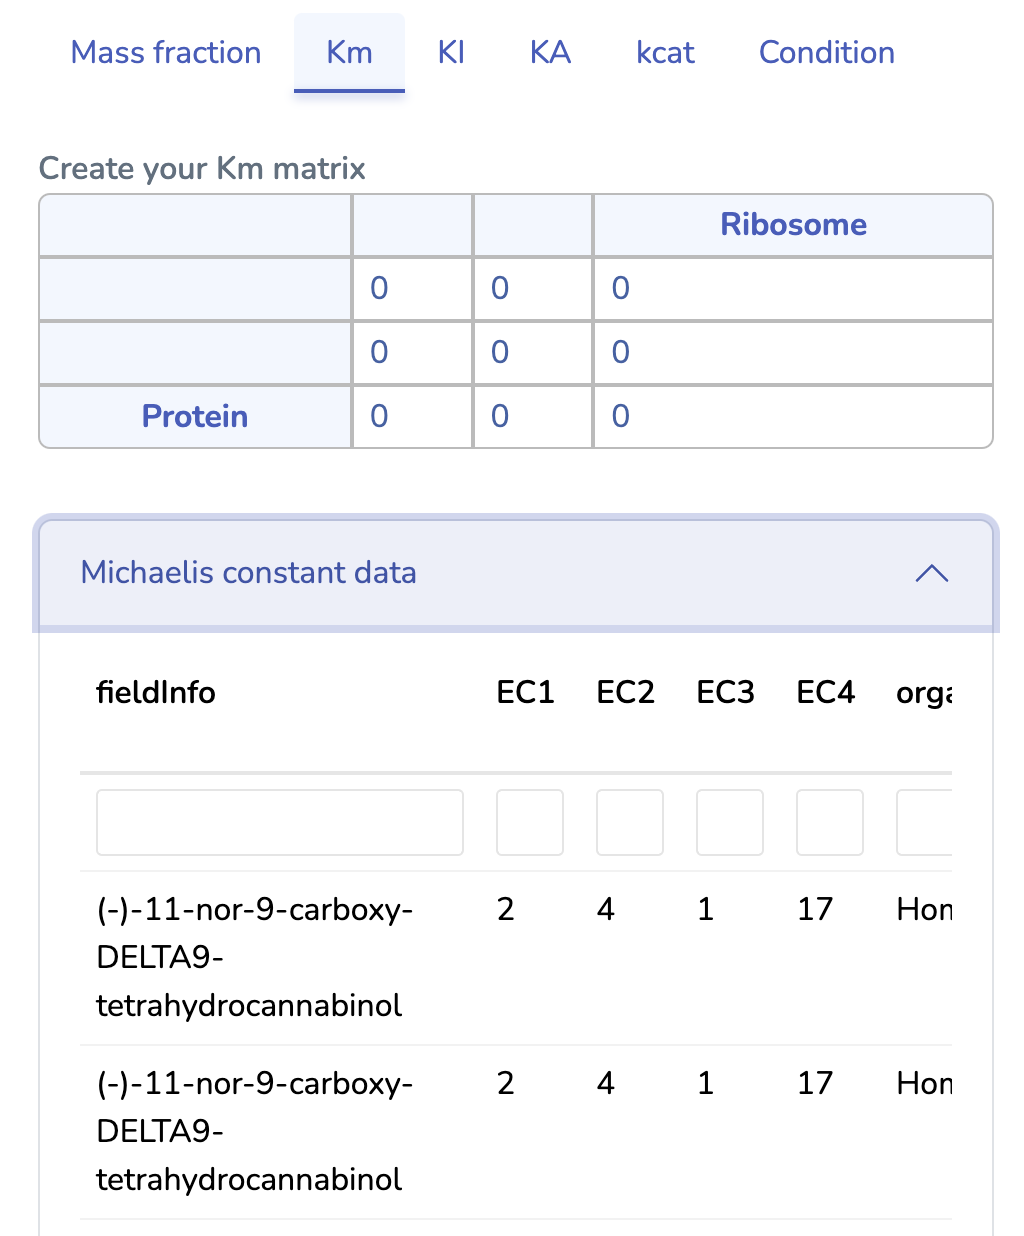
This section displays the Michaelis Constant (Km) matrix of your created GBA model. Make sure each substrate in your reactions has a valid Km value; otherwise, a default value of 0.1 g/L will be used. You can also search for Km values in the table below, sourced from the BRENDA database. Please ensure Km values are mass balanced and converted to g/L by multiplying the Km values in molar units by the molecular weights of the respective substrates.


This section displays the Inhibition Constant (KI) matrix of your uploaded GBA model. You can modify the values directly here.

This section displays the Activation constant (KA) matrix of your uploaded GBA model. You can modify the values directly here.

This section displays the Turnover Number (kcat) matrix of your created GBA model. You can search for kcat values in the table below, sourced from the BRENDA database. Ensure that kcat values are mass balanced and converted to 1/h (mass of product/mass of enzyme/hour) by multiplying the kcat values in 1/h units by the molecular weight of the respective product and dividing by the mass of its enzyme. "kcatf" and "kcatb" indicates the kcat for forward and backward reactions, respectively.


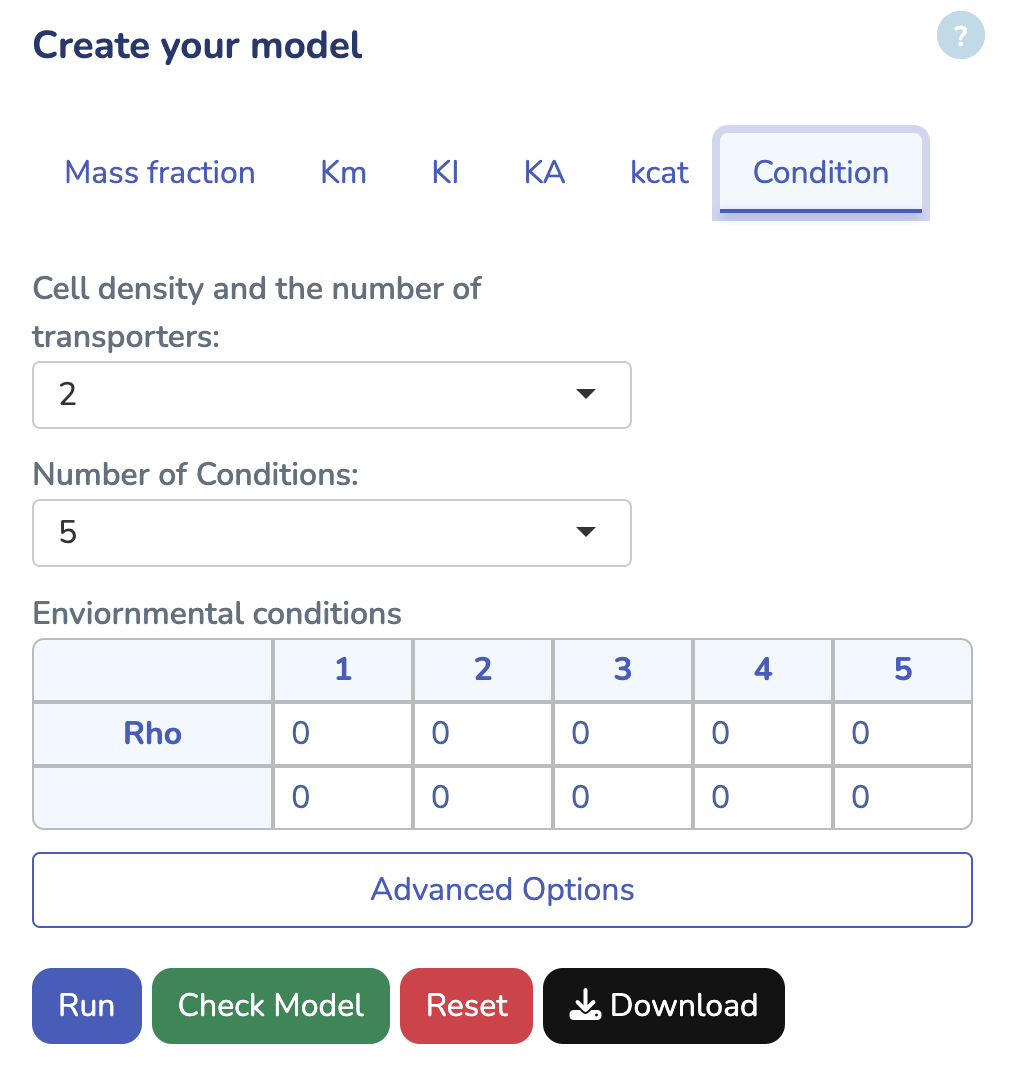
This section displays the External Concentration and Cell Density matrix. You can select the desired number of conditions and external metabolites. The parameter "Rho" represents the cell density in your model, while the other rows show the external concentrations. Ensure that all external concentrations are labeled with "x_". You can modify these values and rerun the optimization by clicking "Run" to see the changes. To download the latest version of your edited GBA model, click "Download."

Download
Number of Conditions
Maximum Growth rate
 h-1
Average of Total Protein Concentration
 [g L-1]
Number of Converged Optimization

Interactive Plots

In this section, you can visualize the results by selecting different axes, such as Growth Rate, Protein Fractions/Concentrations, Fluxes, and more.


Pathway Visualization

In this section, you can view the network visualization of your GBA model. The dot size represents metabolite concentrations, while the line thickness indicates protein concentrations, both as results from the optimization. You can download the visualization results below.
Tutorial

Getting Started with GBApp

Welcome to GBApp, your user-friendly platform for exploring Growth Balance Analysis (GBA) in metabolic modeling. GBApp is designed to make modeling cellular growth and metabolism accessible to all, from seasoned computational researchers to newcomers. Unlike traditional tools focused on linear models, GBApp brings a nonlinear approach that considers the crucial role of metabolite concentrations and reaction kinetics in shaping cellular processes. In this tutorial, you’ll be introduced to GBApp's intuitive interface, where you can easily construct and analyze GBA models without needing to code. You’ll see how GBApp integrates with the BRENDA enzyme database, allowing you to retrieve essential kinetic parameters like turnover numbers and Michaelis constants to create more accurate models. We’ll guide you through using our interactive visualization tools—customizable plots and dynamic pathway maps—that make it simple to interpret your results and gain insights into cellular resource allocation and proteome efficiency. With GBApp, you can dive into the complexities of cellular metabolism with ease, empowering you to explore, collaborate, and drive new insights in the field. GBApp is freely accessible to all users, promoting open science and collaboration within the research community.

Model Input

In GBApp, uploading your GBA model is straightforward. As shown in the figure, users can start by uploading the model file in an open-source spreadsheet format (ODS) via the “Choose File” button. If you haven’t yet prepared your model, you can download a preformatted GBA template using the “Download GBA template” button (Figure 1). This template provides a structured example that includes all required matrices and columns, helping you set up your model correctly.

GBApp model upload interface

Figure 1: Interface for uploading your GBA model file and downloading the GBA template in GBApp.